
News
Upper-troposphere, lower-stratosphere aerosol package successfully flight-tested for high-altitude airborne science
NASA, SSAI, and the University of Denver have developed and flight-tested the instrument package Particles in the Upper Troposphere and Lower Stratosphere (PUTLS; Figure 1), which characterizes the microphysical properties atmospheric aerosol from the NASA high-altitude aircraft. Particles in the UTLS impact global climate, ozone abundance, and cloud formation. Accurate size distribution measurements in the diameter range from a few nanometers to a few microns provide information about the impact of aerosol surface on ozone chemistry, the optical properties of long-lived volcanic particles, and the lifetimes of sedimenting particles.
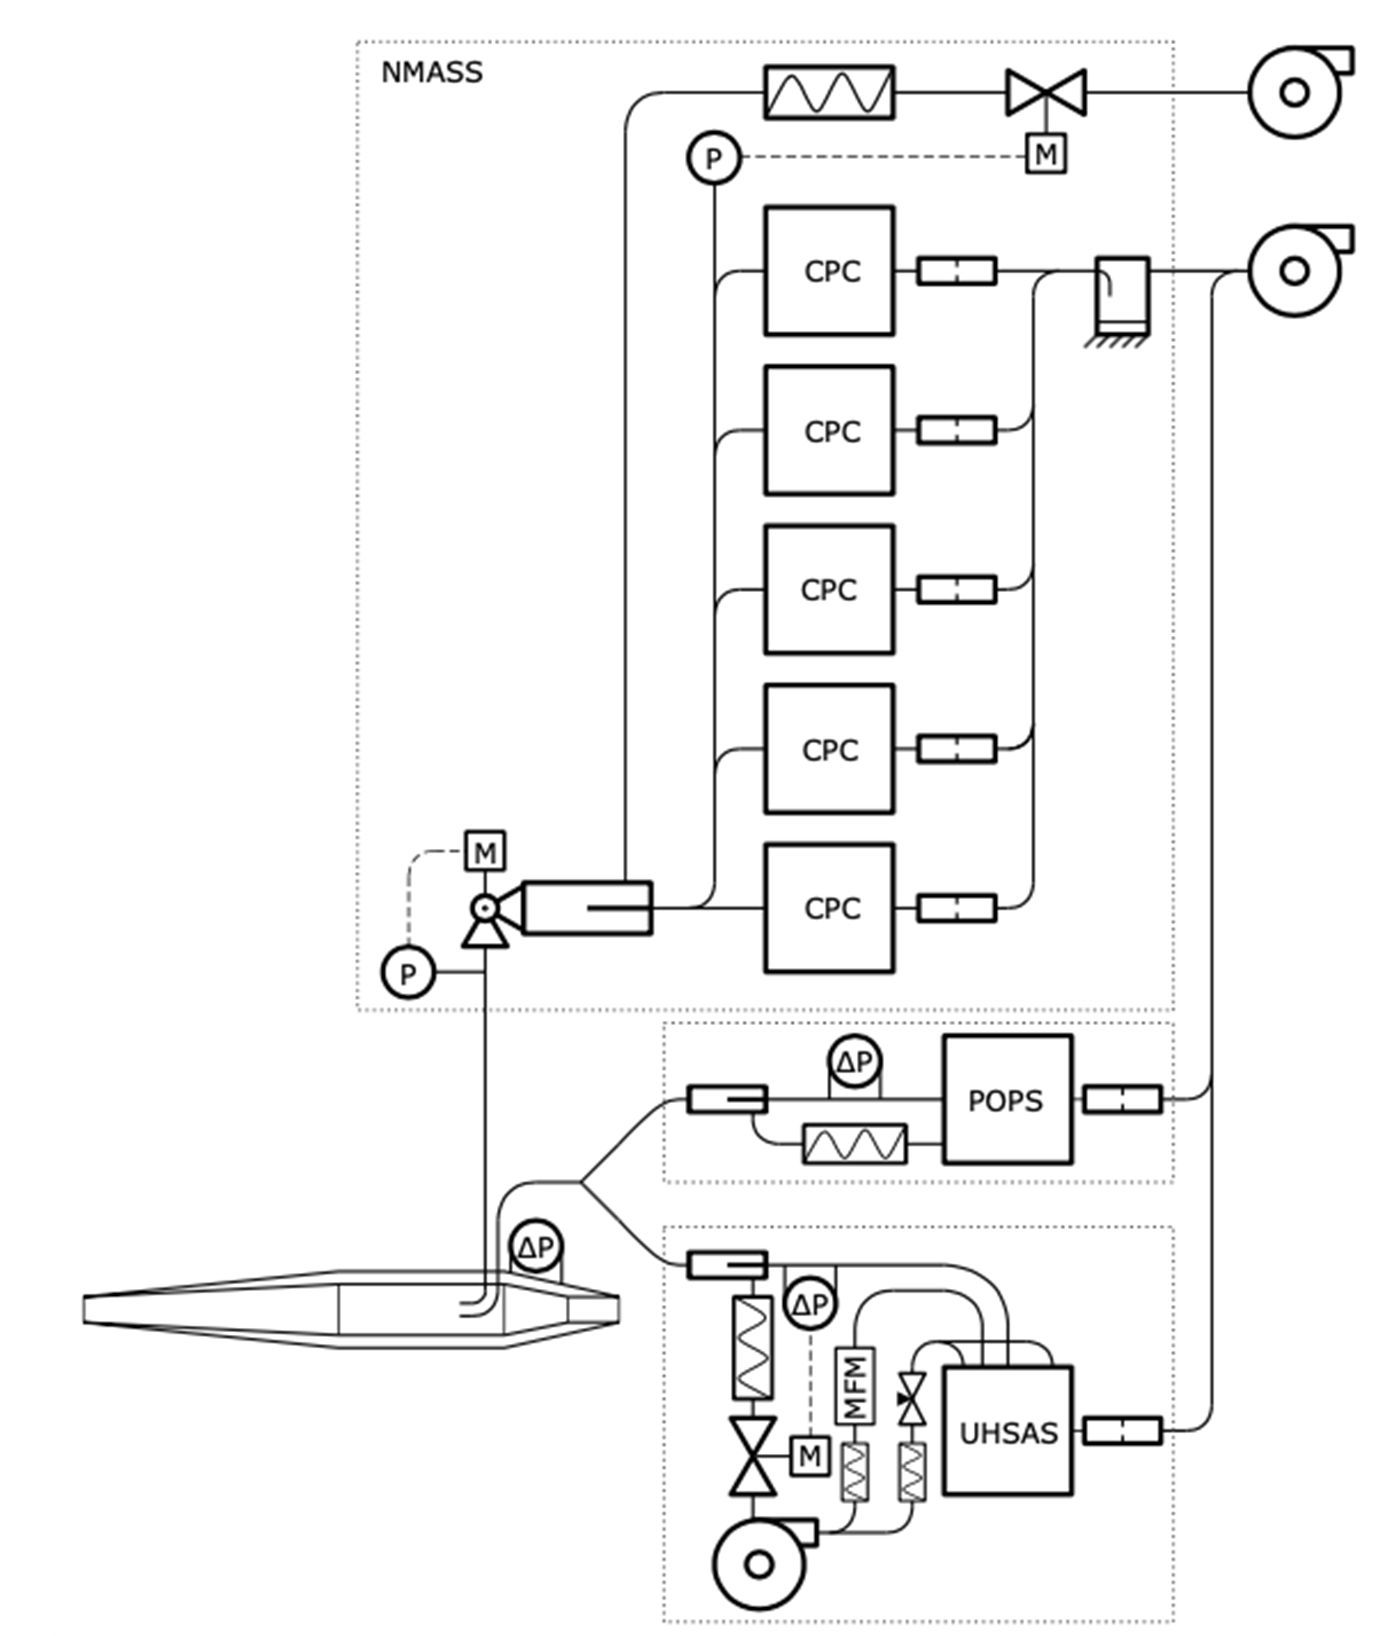
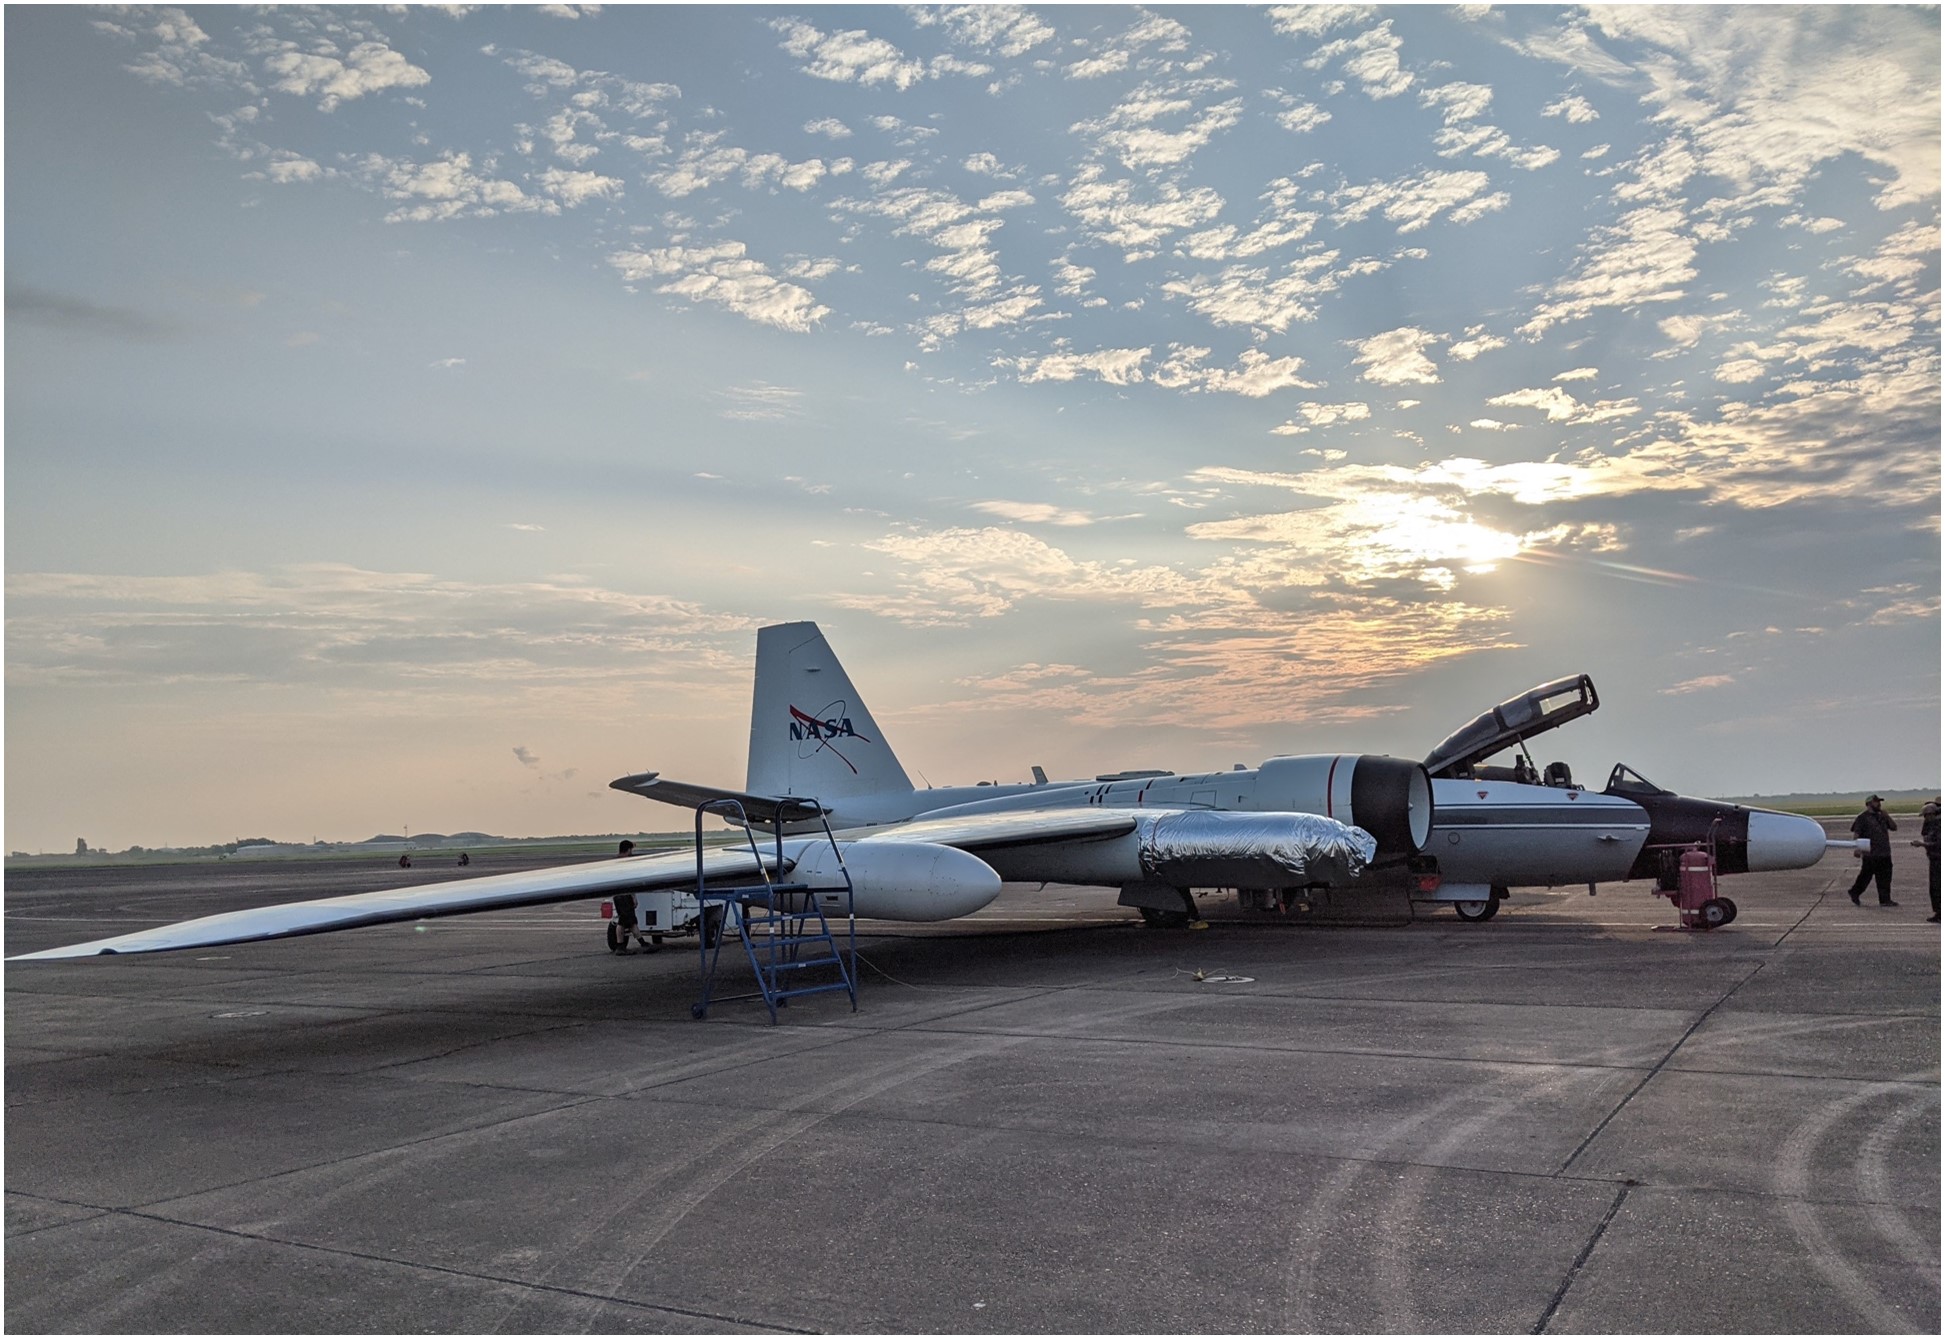
NASA’s PUTLS is a suite of instruments covering a particle size range from 3 to 3000 nm and recently participated in the WB-57F (Figure 2) test flights for the Asian Summer Monsoon Chemical and Climate Impact Project (ACCLIP). PUTLS is comprised of the Nuclei-Mode Aerosol Size Spectrometer (NMASS; Williamson et al., 2017), the Ultra-High Sensitivity Aerosol Spectrometer (UHSAS; Kupc et al., 2017), and the Printed Optical Particle Spectrometer (POPS; Gao et al., 2015). The Passive, Near-Isokinetic Inlet (PNII) used with these instruments permits quantitative sampling over the size range at the anticipated conditions. These instruments are optimized by NASA LaRC for UTLS conditions and can differ in fluid dynamics, control system design, heat transfer methods, and material choices from the versions used at lower altitudes.
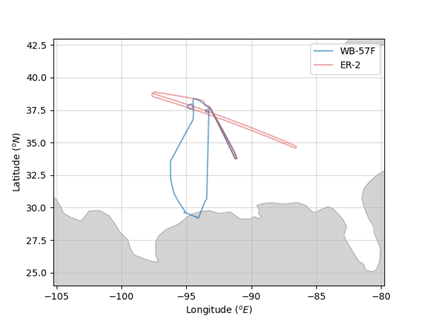
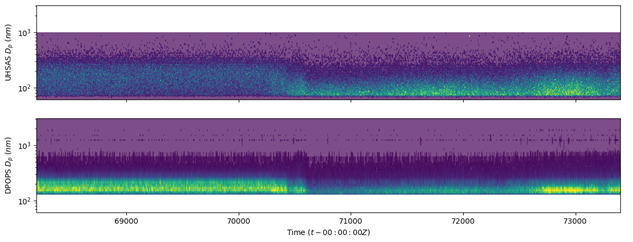
 During test flights, instrument performance was reviewed and co-validated with the aerosol package on the NASA ER-2 (Figure 3) for the DCOTSS mission, during a rendezvous between the two aircraft (Figure 4). The PUTLS UHSAS on the WB-57F was compared with the DPOPS on the ER-2 for two constant-altitude runs, in the lower stratosphere and upper troposphere, showing excellent correlation in the structures and trends of the particle size distributions throughout the region of coincident measurements (Figure 5). The contour plot y-scales for each instrument are matched to illustrate instrument size range relative to one another, where UHSAS sizing captures the full accumulation mode in the stratosphere (60-1000nm), and DPOPS has the advantage of detecting 1-3um coarse-mode particles. The higher intensity of the DPOPS signal is the result of coarser size-binning, decreasing resolution but increasing statistics, in addition to a higher sampling rate.
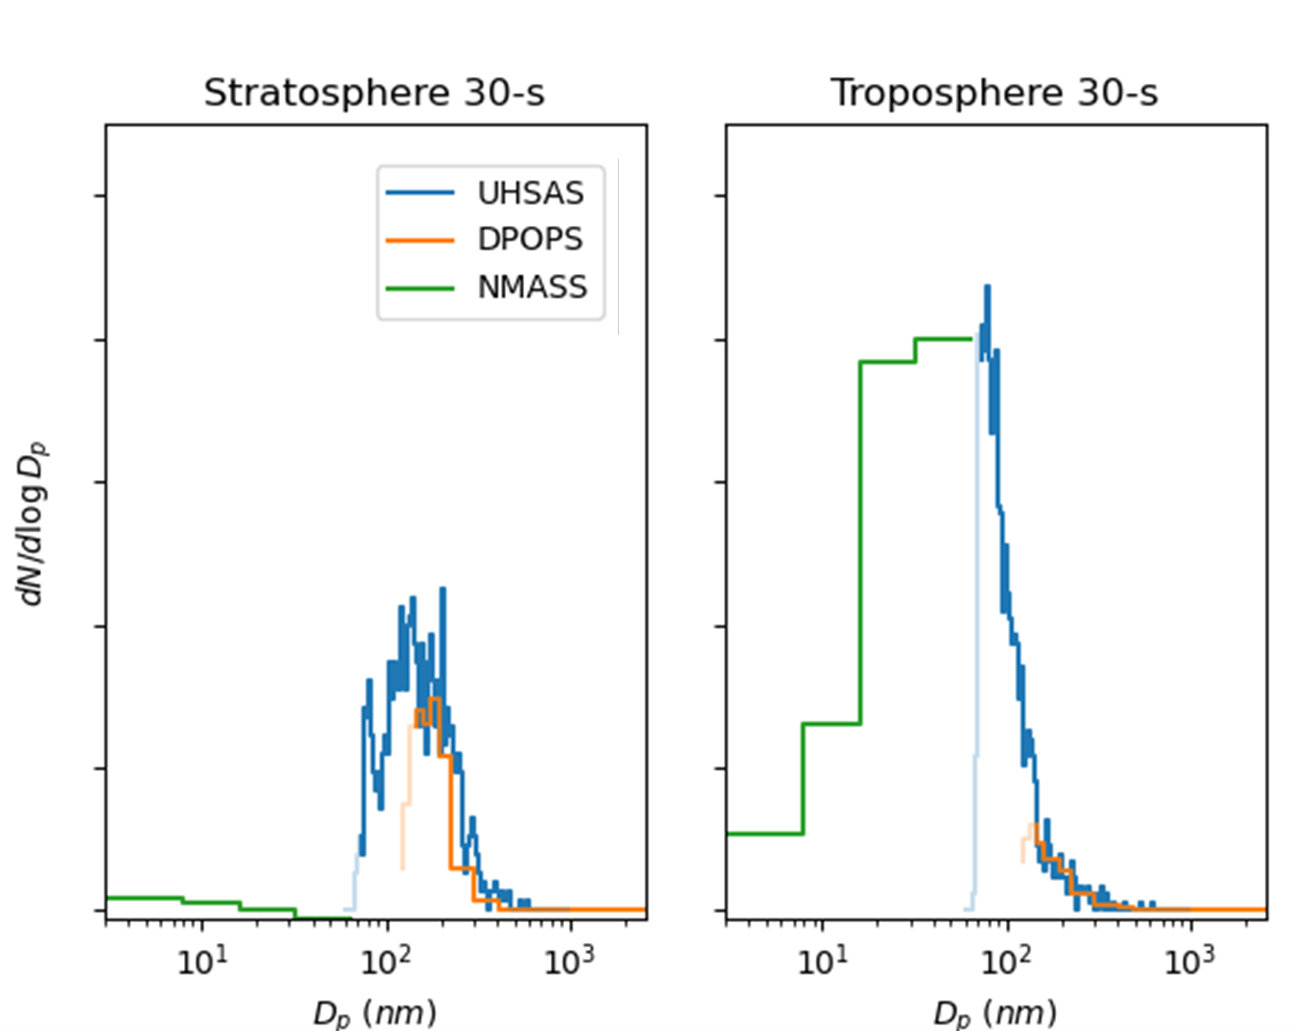
Adapting the temporal contours into frames of 30-s averaged size distributions, we can see the particle sizing from the UHSAS, DPOPS, and NMASS simultaneously (Figure 6). There are a few important conclusions that can be drawn from the size distributions produced by the instruments. Due to missing important sizing information at diameters smaller than 150nm, DPOPS misinforms the size distribution shape and peak in the stratosphere. It should also be noted that the smallest bins of the optical instruments, UHSAS and DPOPS, are truncated due to decreased particle counting efficiency, a consequence of the sizing technique. However, there is excellent agreement in the instruments in addition to continuity between instruments of different size range, illustrated with the continuous size distribution curve in troposphere. Overall, the agreement found between different instruments from different platforms is remarkable and supports co-validation of the two aerosol packages.
Article Credit: Matthew Brown (SSAI/ NASA Langley Research Center), James Wilson (University of Denver), and Luke Ziemba (NASA Langley Research Center)